A graph is a set of choices
Graphs help us see patterns that would be hard to find in a table of numbers. But a graph is not a transparent window onto an experiment. Someone chooses which measurements to include, how to group them and how to display them. Those choices may be reasonable, yet they can change a reader’s impression.
The most useful first question is not “Is this graph misleading?” but “What, exactly, does it show?” Read the title, axis labels, units and caption before interpreting the shape. Check whether the measurements come from a single experiment, a series of observations or a model. Then ask what information would help you judge the apparent pattern.
Axes can make changes look larger or smaller
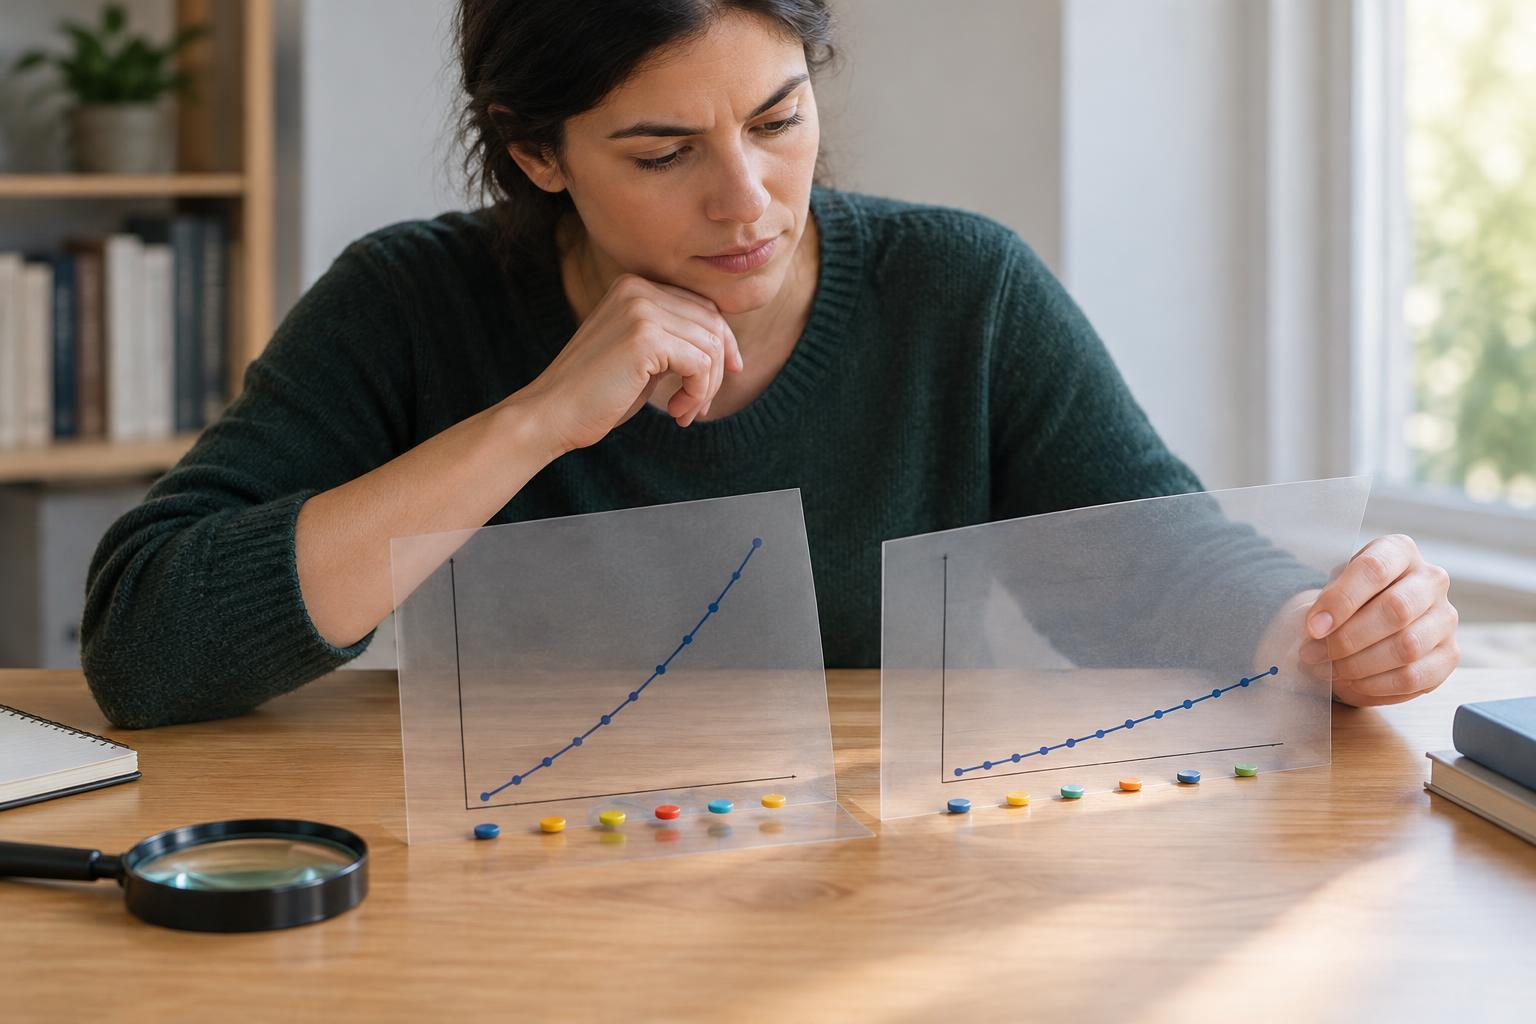
Suppose a graph shows a measurement rising from 98 to 102. If its vertical axis begins at 97, the line may appear to climb sharply. If the axis begins at zero, the same change will look modest. Neither view is automatically wrong. A narrow range can reveal small but important differences; a wider range can provide a sense of overall scale. The key is to read the numbered ticks rather than judging the slope by eye.
Bar charts deserve particular care because viewers often interpret bar length as the quantity being compared. Starting a bar chart well above zero can exaggerate differences between bars. Line graphs, which emphasize movement between points rather than bar length, have more flexibility, but their scales still matter.
Also check whether an axis uses equal numerical steps. On a logarithmic scale, equal distances represent equal ratios, not equal additions. That can be useful for values spanning a wide range, but it changes how the line should be read. A broken axis or two different vertical axes on one chart can be useful too, provided the labels make the choices clear.
Missing points and selected windows change the story
A graph may show a real trend over the period displayed while hiding what happened before or after it. A short interval can make an ordinary fluctuation look like a lasting shift. A long interval can smooth over a brief change that matters for the question at hand. Look for the time span and the spacing of measurements: a line connecting two points does not prove that the quantity changed steadily between them.
Selection can also happen before the graph is drawn. For example, a chart of plant growth might include only the plants that survived to the final measurement. That could answer a question about surviving plants, but it would not describe every plant that began the experiment. Ask what was measured, what was left out and whether the displayed sample matches the claim in the accompanying text.
Averages can hide variation
Two groups can have different averages yet still contain many overlapping observations. A chart showing only one bar per group may conceal that overlap. Individual points, ranges, distributions or uncertainty markers can offer more context, although each displays different information. If a graph includes error bars, read the caption to find out what they represent. They might describe variation among measurements or uncertainty in an estimated value; those are not the same thing.
Group definitions matter as well. Imagine comparing an average result across two neighborhoods when the ages of the people measured differ greatly between them. The overall comparison might partly reflect that difference in composition. Breaking results into relevant subgroups can clarify a pattern, but tiny subgroups can be noisy. Neither an overall average nor a detailed breakdown tells the whole story on its own.
A pattern does not explain its cause
Two plotted quantities may rise and fall together without one causing the other. Both could respond to a third factor, or the apparent relationship could depend on how the data were collected. A graph can establish that certain values were recorded and can suggest a question worth testing. By itself, it rarely explains the mechanism behind a pattern.
When a graph supports a strong claim, look for a clear comparison: What would we expect to see if the proposed explanation were wrong? Were other plausible influences considered? Finally, try describing the chart without adopting its headline: “In these measurements, this quantity increased over this interval” is often more faithful than “This proves what will happen next.” Careful reading does not require distrusting every graph. It means separating what the picture displays from what we infer.