Turning starlight into a spectrum
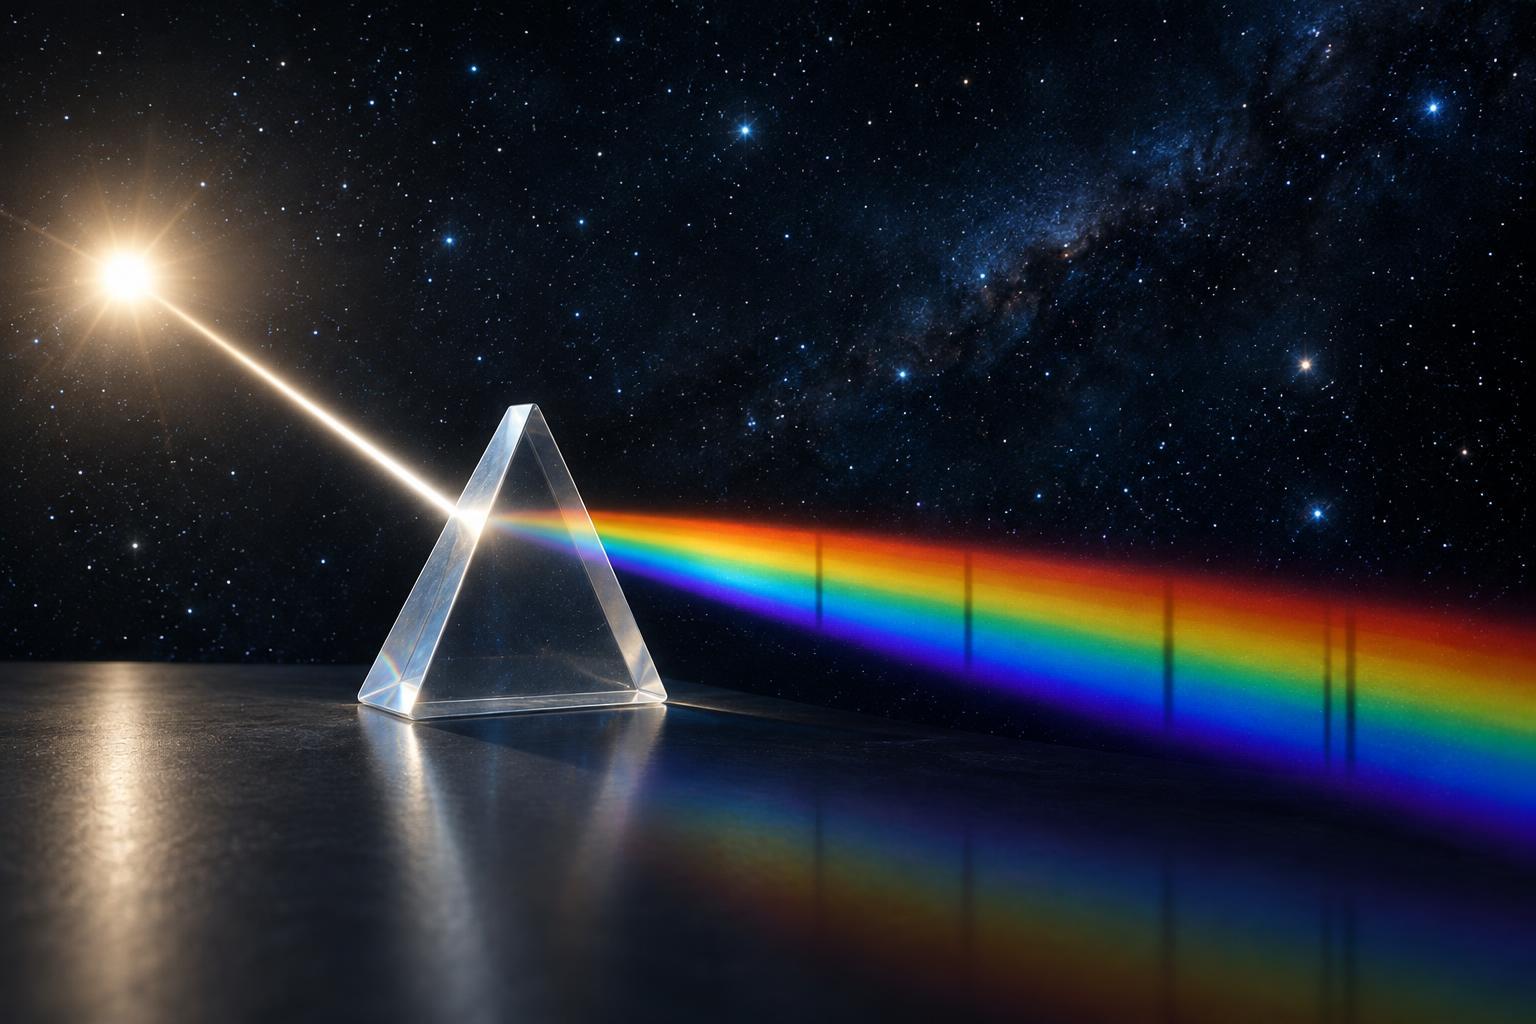
A star may look like a single point of light, yet that light contains a remarkable amount of information. To examine it, astronomers pass starlight through an instrument called a spectrograph. A prism or diffraction grating separates the light by wavelength, spreading it into a spectrum. Instead of measuring only how bright the star looks overall, astronomers can see how much light arrives at each wavelength.
A hot, dense part of a star produces light across a broad range of wavelengths. On its way out, that light passes through the star’s cooler outer layers. At particular wavelengths, atoms and ions in those layers absorb some of it. The resulting spectrum contains narrow dips, often called absorption lines. The pattern resembles a barcode: the positions of the dips provide clues to which substances are present.
This is not a matter of reading colors by eye. Many useful lines are too fine to distinguish without an instrument, and some lie outside visible light. Spectrographs make it possible to measure their positions and strengths rather than simply describe a star as red, white, or blue.
Why elements leave different patterns
Electrons in an atom can occupy only certain energy levels. When an atom absorbs light, an electron may move to a higher level—but only if the light carries the right amount of energy. Because wavelength and energy are related, this produces absorption at specific wavelengths. Different elements have different arrangements of electrons, so they tend to leave different sets of lines.
Astronomers identify an element by looking for a matching pattern, not by relying on a single dip. A line from one substance may overlap with a line from another, but several lines at the expected relative positions make a more convincing identification. The same principle can reveal whether atoms have lost electrons and become ions, which produce their own characteristic patterns.
Hydrogen and helium are prominent ingredients in stars, while astronomers also look for lines associated with elements such as calcium, iron, and oxygen. Finding a line tells us that the relevant atoms or ions affect the light we receive. It does not, by itself, tell us exactly how much of that element the entire star contains.
From line patterns to chemical abundance
The strength of an absorption line can help estimate an element’s abundance, but the relationship is not as simple as “darker means more.” Temperature determines how many atoms are in the right state to absorb a particular wavelength. At higher temperatures, some atoms become ionized, changing which lines appear. Pressure and conditions in the star’s atmosphere also affect line shapes and strengths.
To account for these effects, astronomers compare an observed spectrum with models of stellar atmospheres under different conditions. They adjust properties such as temperature, surface gravity, and composition to find a combination that reproduces multiple features of the spectrum. Checking several lines is especially useful: if they point toward the same abundance, the estimate is more dependable than one based on a single feature.
These estimates usually describe the star’s visible outer layers, where the escaping light has interacted with gas. A spectrum is not a direct sample of the deep interior. Interpreting what the surface composition says about the rest of the star requires additional knowledge of how stars form and change.
What else the lines can reveal
Spectral lines carry information beyond chemical identity. If a star is moving toward or away from us, its lines shift in wavelength through the Doppler effect. Astronomers can compare an observed pattern with its expected positions to measure motion along our line of sight. Motion does not erase the chemical fingerprint; it moves the pattern together.
Line shapes can offer further clues. Broadening may reflect several effects, including rotation, pressure, and motions in the star’s atmosphere. Separating those effects takes care, particularly when a star’s light is faint or its lines overlap. Even so, a well-measured spectrum lets astronomers investigate composition and physical conditions using the same incoming light.
Why interpretation takes care
Before drawing conclusions, astronomers must consider what happened to the light after it left the star. Gas between stars can add absorption features, and Earth’s atmosphere absorbs some wavelengths before they reach a ground-based telescope. Instruments can introduce their own distortions. Comparing observations, calibrating equipment, and checking which features move with the star help distinguish these effects.
Spectroscopy is powerful because its reasoning can be tested against many lines at once. It does not require visiting a star or bringing back a sample: known behavior of atoms links patterns in light to matter far away. The answer is not simply a list of elements, but a carefully interpreted picture of the star’s visible atmosphere, complete with limits on what the light can tell us.